Plantuml for mindmaps
Blog --- Plantuml for mindmaps
Verfasst: 2022-10-14
As everybody knows: a picture is worth a thousand words.
If possible, I create graphics in text form. For this I prefer to use Plantuml. Sometimes also Graphviz and ditaa.
With all these tools it is possible to describe facts by text and then visualize them. This is enormously helpful for the documentation of projects. If you do it right, texts and graphics are always correct and up to date by building your docs.
For a long time I was looking for a tool with which it is also possible to create mindmaps in text form. At some point I noticed that I can do exactly that with Plantuml.
I use the Arithmetic notation for this. Entries starting with + are displayed on the right side of the center node, entries starting with - are displayed on the left.
Here is a small example:
@startmindmap

+ center

++ right 1
+++ right 1.1
++++_ right 1.1.1
++++_ right 1.1.2
+++ right 1.2
+++ right 1.3
++ right 2
+++ right 2.1
++++ right 2.1.1

-- left 1
-- left 2
--- left 2.1
---_ left 2.2
---- left 2.2.1
---- left 2.2.2
---- left 2.2.3
--- left 2.3
-- left 3

@endmindmap
With this command I create the graphic file example-1.png on my Windows computer:
java -jar d:\apps\tools\plantuml.jar -charset UTF-8 exactly-1.txt
And this is what the graphic will look like:

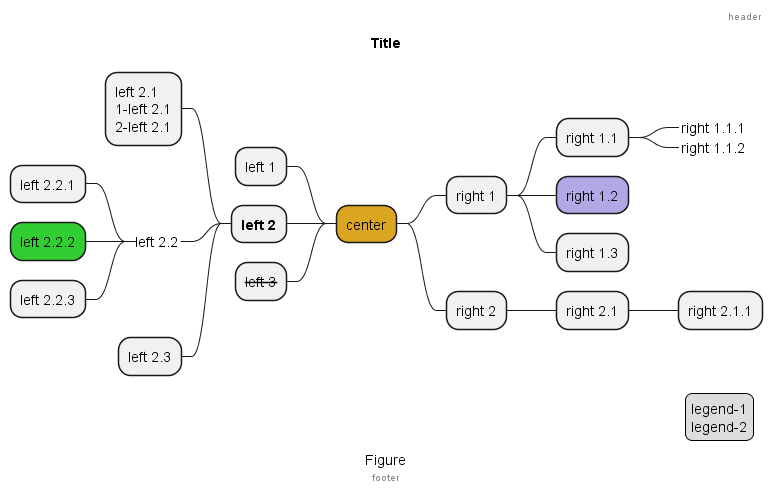
And here is an extended example with formatting, heading, footer, legend etc.
@startmindmap

+[#goldenrod] center

++ right 1
+++ right 1.1
++++_ right 1.1.1
++++_ right 1.1.2
+++[#B4A7E5] right 1.2
+++ right 1.3
++ right 2
+++ right 2.1
++++ right 2.1.1

-- left 1
-- **left 2**
--- left 2.1\n1-left 2.1\n2-left 2.1
---_ left 2.2
---- left 2.2.1
----[#limegreen] left 2.2.2
---- left 2.2.3
--- left 2.3
-- <s>left 3</s>

caption Figure
Title Title

header
header
endheader

center footer footer

legend right
  legend-1
  legend-2
endlegend

@endmindmap
and then the result:

Of course, a lot more is possible. For this I recommend the mindmap page of Plantuml, information about the use of colors and Themes.